
Discovering relationships in textual data : Exploring text mining with VOSviewer and Wordij : Part 1
INTRODUCTION
In this two-part blogpost we focus on VOSviewer and Wordij as data science programs that automate different aspects of natural language processing of unstructured text from various sources*.
VOSviewer is a computer program developed for the creation and visualization of bibliographic maps of science. Recent versions of VOSviewer also include text mining functionalities that support the creation of term maps based on a corpus of documents.
In this first blogpost, we illustrate how VOSviewer can be used to analyze and visualize large amounts of text data. VOSviewer supports the creation of term co-occurrence maps, visualizations that demonstrate the relationships between hihgly occurring terms in a set of documents. This causes frequently co-occurring terms to cluster together. These clusters are interpreted as representing topics in a body of text. The visualization of terms provides a way to explore a set of documents and uncover latent patterns.
In part 2 we use VOSviewer in combination with WORDij, a software tool for computational content analysis. WORDij uses semantic network analysis of texts through co-occurrence analysis of word pairs. We illustrate how Wordij retrieves a word network from text data and use VOSviewer to obtain a graphical representation of the structure of the word network.
THE DATA
We outline the process for generating co-occurrence maps with VOSviewer using the body of newspaper articles on “gender equality” that appeared in The Guardian in a one-year period before and since the “#MeToo” hashtag. Starting in early october 2017, the “#MeToo” hashtag became a global movement that elevated a global consciousness around the obstacles and power imbalances that women encounter in their daily lives.
We gathered newspaper articles from The Guardian through the use of its API and the GuardianR package. The get_guardian function searches for the keywords “gender + equality”within the data range of 2016-10-05 and 2017-10-04 to get articles on gender equality in a one-year period before the use of the “#MeToo” hashtag. This resulted in the selection of 130 newspaper articles. Using the same key for the period between 2017-10-06 and 2018-10-05 resulted in the selection of 196 articles on gender equality (we refer to both periods as “articles before #MeToo” and “articles since #MeToo”)**.
To prepare the 326 articles for further analysis we first cleaned to raw text data in a R script (removing unnecessary characters, remove numbers, punctuations and whitespace, remove stopwords, and so on).
Before starting the analysis with VOSviewer, we wanted to have a general idea of the newspaper content. To that end, we tokenized the text using the tidytext package and with the quanteda package we constructed a comparison wordcloud of frequently used words in articles from both periods.
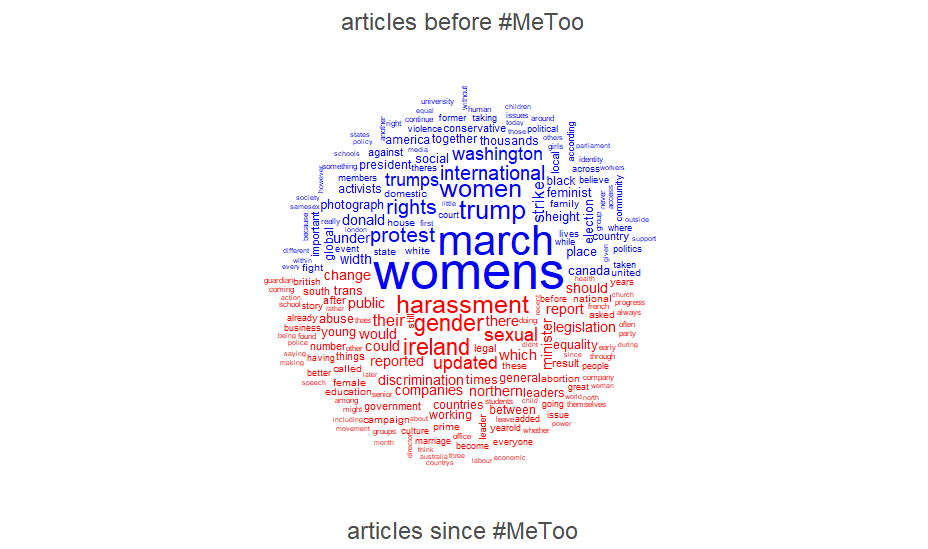
A prominent theme in “articles before #MeToo” is the focus on women’s rights and women’s activism especially against Trump’s policy position towards a wide range of groups. The most frequently used words in “articles afer #MeToo” refer primarily to gender-related issues as the movement against sexual abuse and sexual harassment.
ANALYSIS AND VISUALIZATION USING VOSviewer
A central theme in text mining to explore and visualize central themes in a text corpus, is the creation of a term co-occurrence map. Terms that occur together in a set of documents are visualized in a low-dimensional map that represents the relationships between terms as a network. Terms are the nodes and the links between terms are based on their co-occurrence.
Although VOSviewer was initially designed to create bibliometric maps, the software performs well for creating co-occurrence maps. VOSviewer applies a distance-based mapping technique referred to as Visualization of Similarities (VOS). The distance between terms in a co-occurrence map corresponds to their similarity. As a result, frequently co-occurring terms cluster together and the clusters can be interpreted as representing the central themes in a set of documents.
We created a co-occurrence map for each period the articles were extracted from. The terms are taken from the body text of each article (article titles were excluded).
VOSviewer distinguishes several steps to construct a term map from a corpus of documents. First, the software identifies the noun phrases (keywords, terms) in documents. Thereafter, the most relevant noun phrases are selected. These relevant terms are used for clustering. Finally, the clustering results are mapped and the visualization of terms and clusters can be explored interactively. We explain the workflow to generate co-occurrence maps.
After launching VOSviewer, we select the option “Create” in the opening screen and choose “Create a map based on text data”. The text file for the first period (“articles before #MeToo”) is specified as “VOSviewer corpus file”. The option of specifying a scores file is left blank. We process the text data by clicking the “Next” tab which causes VOSviewer to extract the terms from the documents (articles).
The screen “Choose counting method” specifies to calculate the frequency of terms by using binary counting or full counting. We applied binary counting. The example below delineates the differences between both methods. We ignore the thesaurus file (to eliminate certain terms ; deselection of terms is also possible in a later stage).
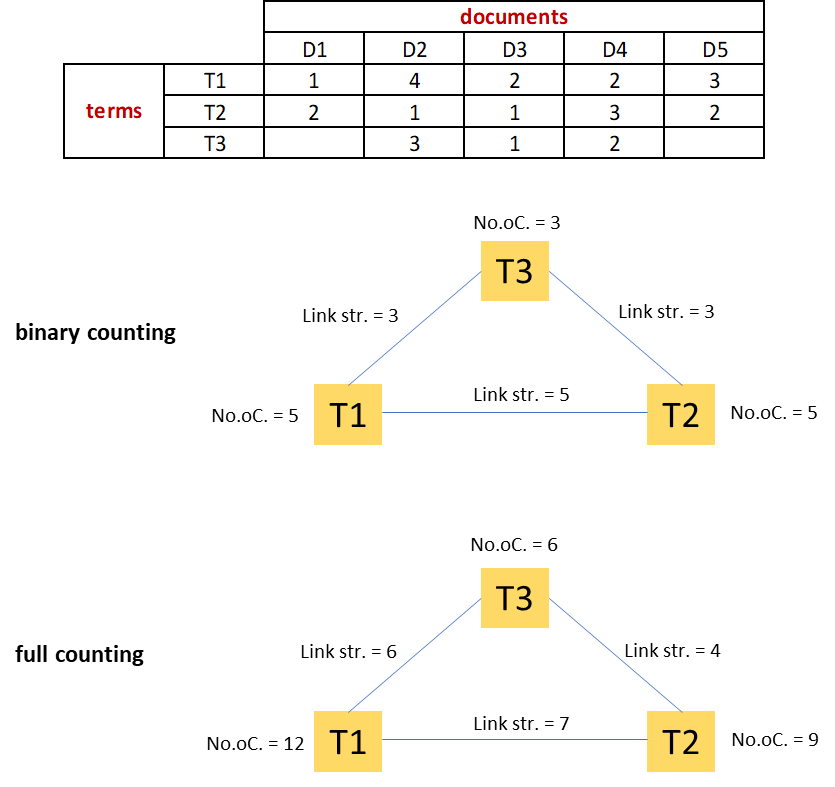
In contrast to the full counting method, whereby all occurrences of a term in all documents (articles) is counted, in the binary method only the presence or absence of a term in a document is counted (once) and the strength of the links between terms is based on the number of times that they occur together. The binary counting method is especially suited for large texts and prevents that term maps are skewed by a single term appearing frequently within one document. it is, the way you tell your story online can make all the difference.
Next, a minimum occurrence threshold must be defined. VOSviewer uses a threshold of 10, which we used. The total number of terms in the dataset of '“articles before #MeToo” is 16.388, and 325 terms meet the threshold.
VOSviewer calculates a relevance score for these 325 terms and 195 terms were selected as the most relevant terms. The relevance score is useful for filtering the more informative terms that better represent specific topics.
The co-occurence map we finally get was normalized with the association strength method and clustered with resolution parameter equal to one and the minimum cluster size equals five.
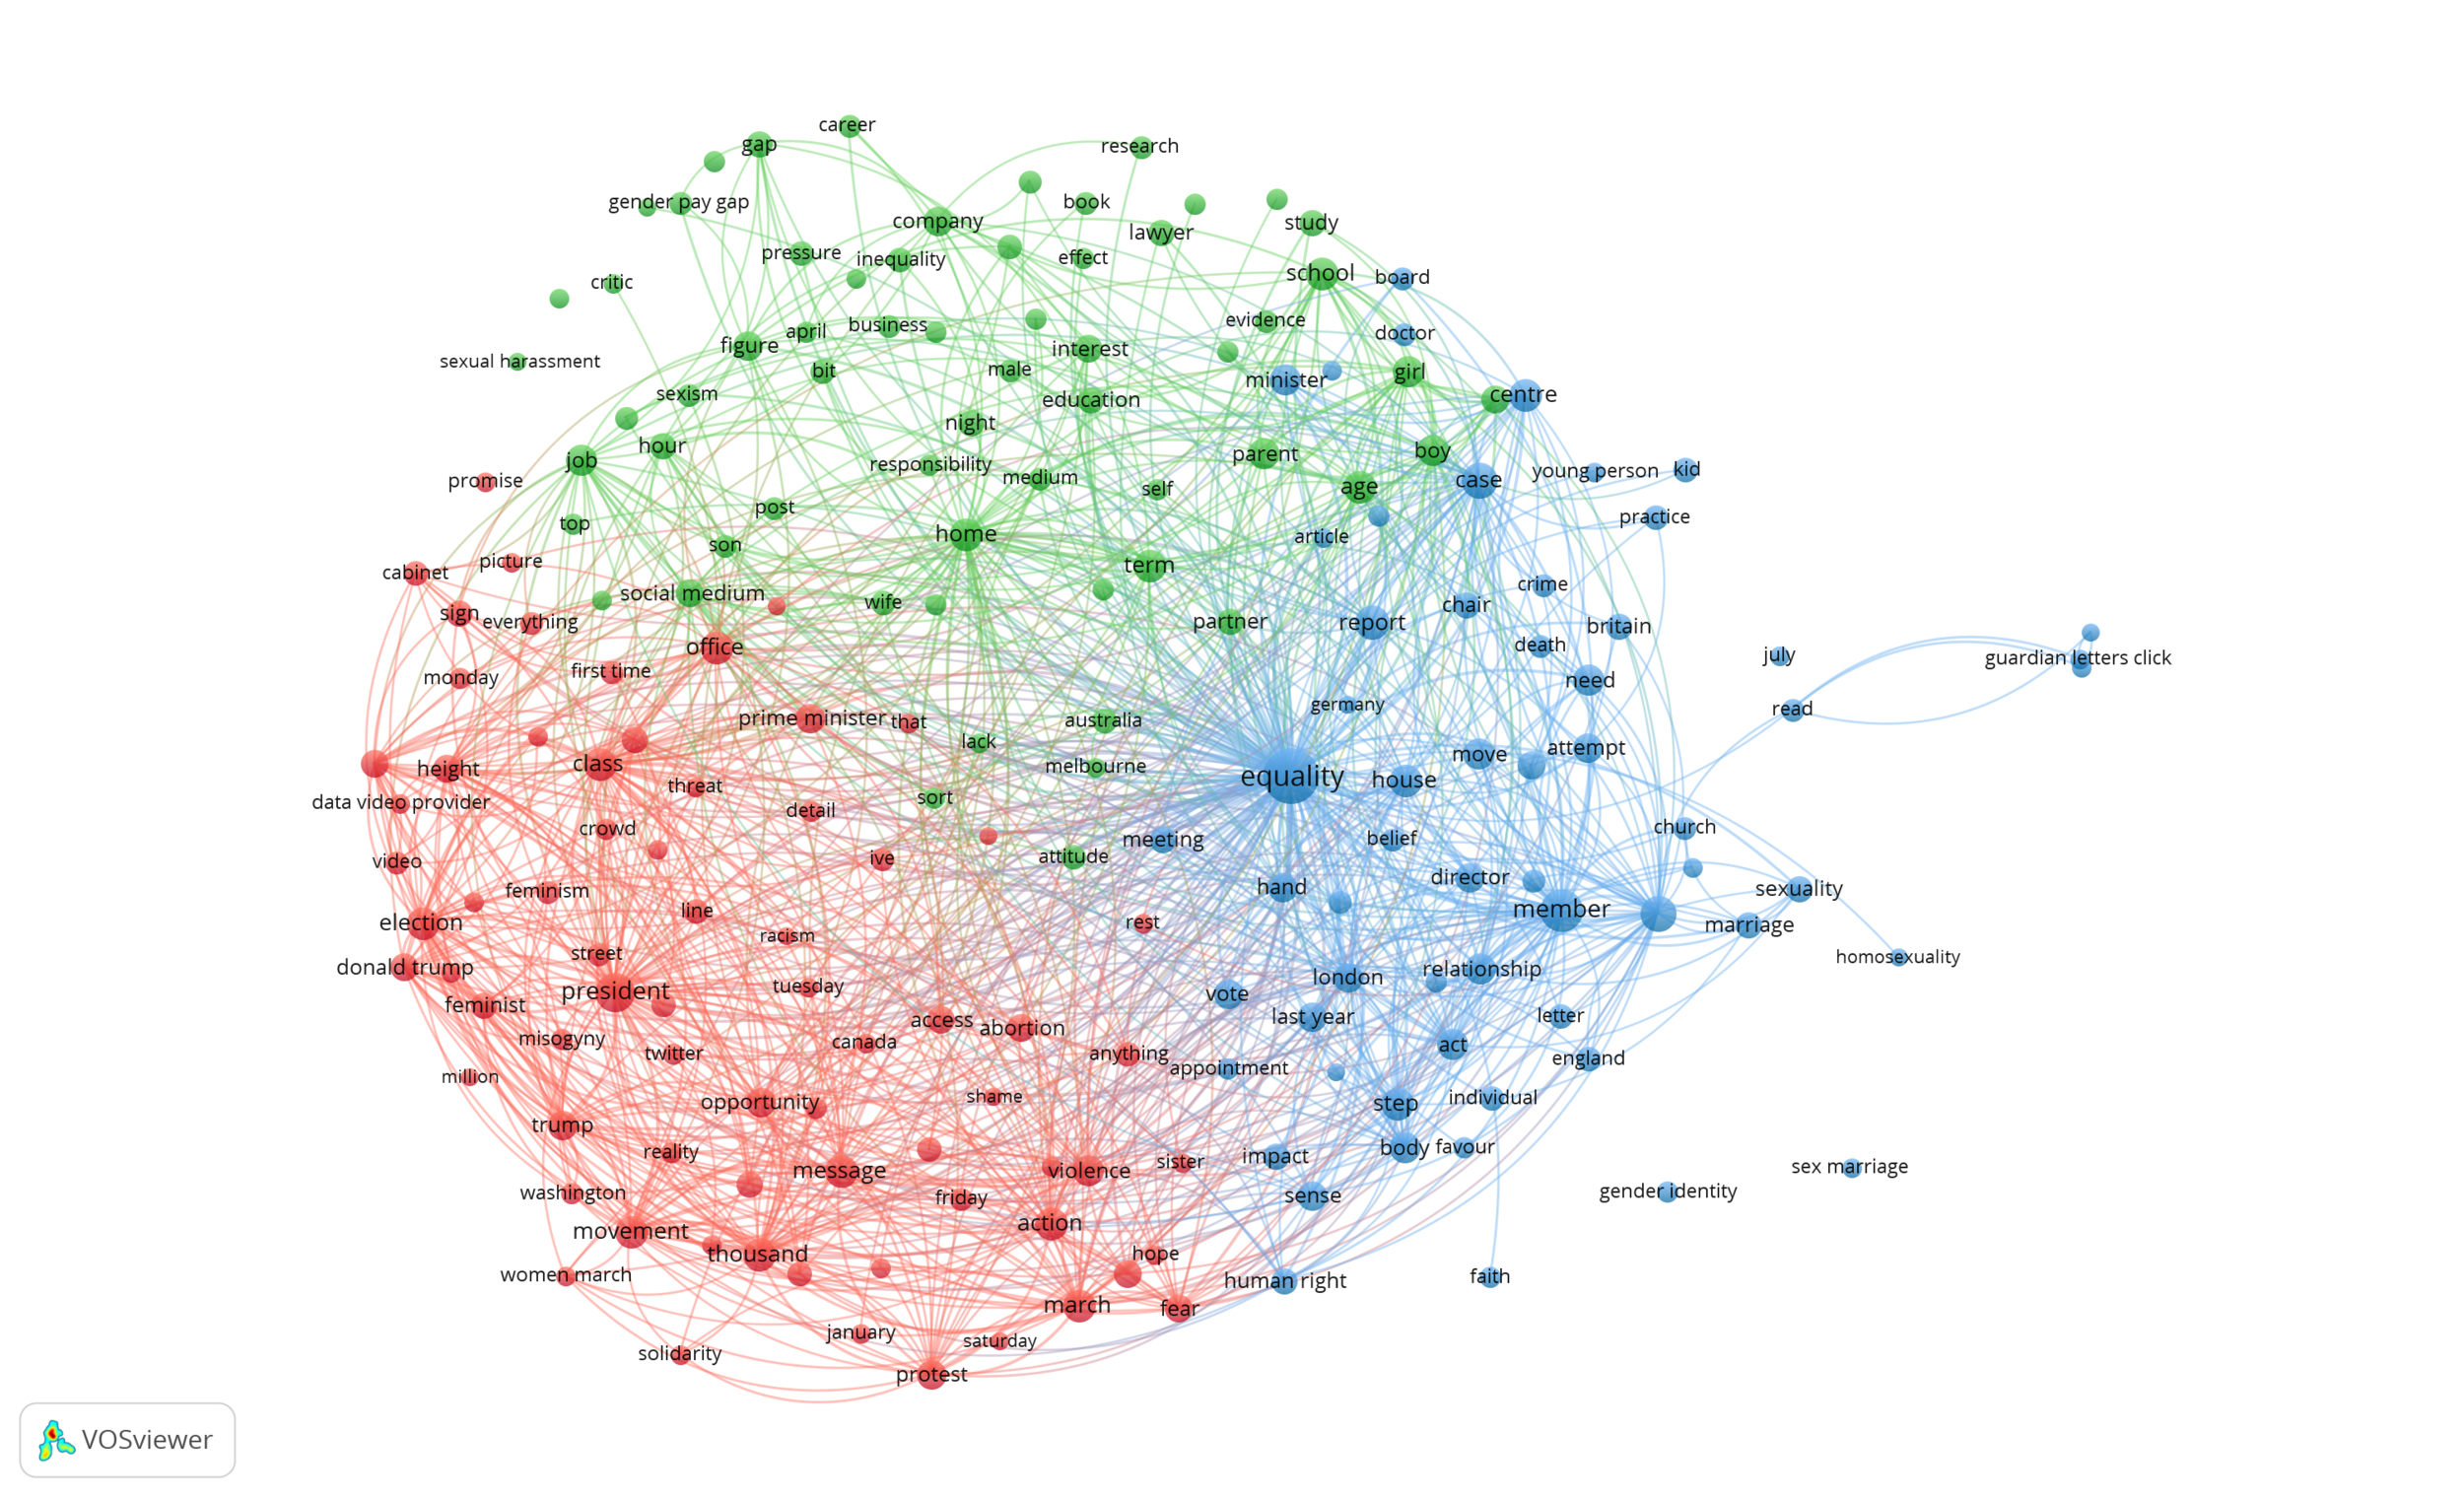
Map of co-occurrences based on terms in “articles before #MeToo”
The above network distinguishes the terms into three clusters (each consisting of resp. 72, 62 and 61 items/terms). The red coloured terms refer to the people who gathered in cities around the world as part of the international day of action in solidarity with the Womens March on Washington after the inauguration of Donald Trump as the president of the US. Focus is on women’s activism and the worries about Trumps politics and his attitude towards women and minority groups.
Although the terms are grouped in separate clusters, there exists also an important overlap between them. All terms share a mutual concern with gender-related issues in the public and private sphere.
We applied the same steps described above to “articles since #Metoo”. From the 196 articles in the second time period, a total of 20.753 terms were extracted of which 610 meet the threshold of 10 occurrences and 366 relevant terms are used to compose the co-occurrence map.
As shown in the figure below, the network of 366 nodes represents the connected articles of the data set in the period since #MeToo, and it is grouped into six clusters of resp. 107, 72, 65, 57, 52 and 12 items/terms. The first cluster (red) is primarily concerned with terms referring to legislation about abortion in Ireland. The second cluster (green) groups terms about the metoo movement (gender discrimination, domestic violence, sexual abuse, sexual harassment, sexual misconduct, sexual violence). The third cluster (dark blue) centers around the gender pay gap discussion. Cluster 4 (light green) and cluster 5 (purple) group terms about resp. gender equality and international women’s day. The sixth cluster (light blue) only groups 12 terms items/terms and is difficult to label.
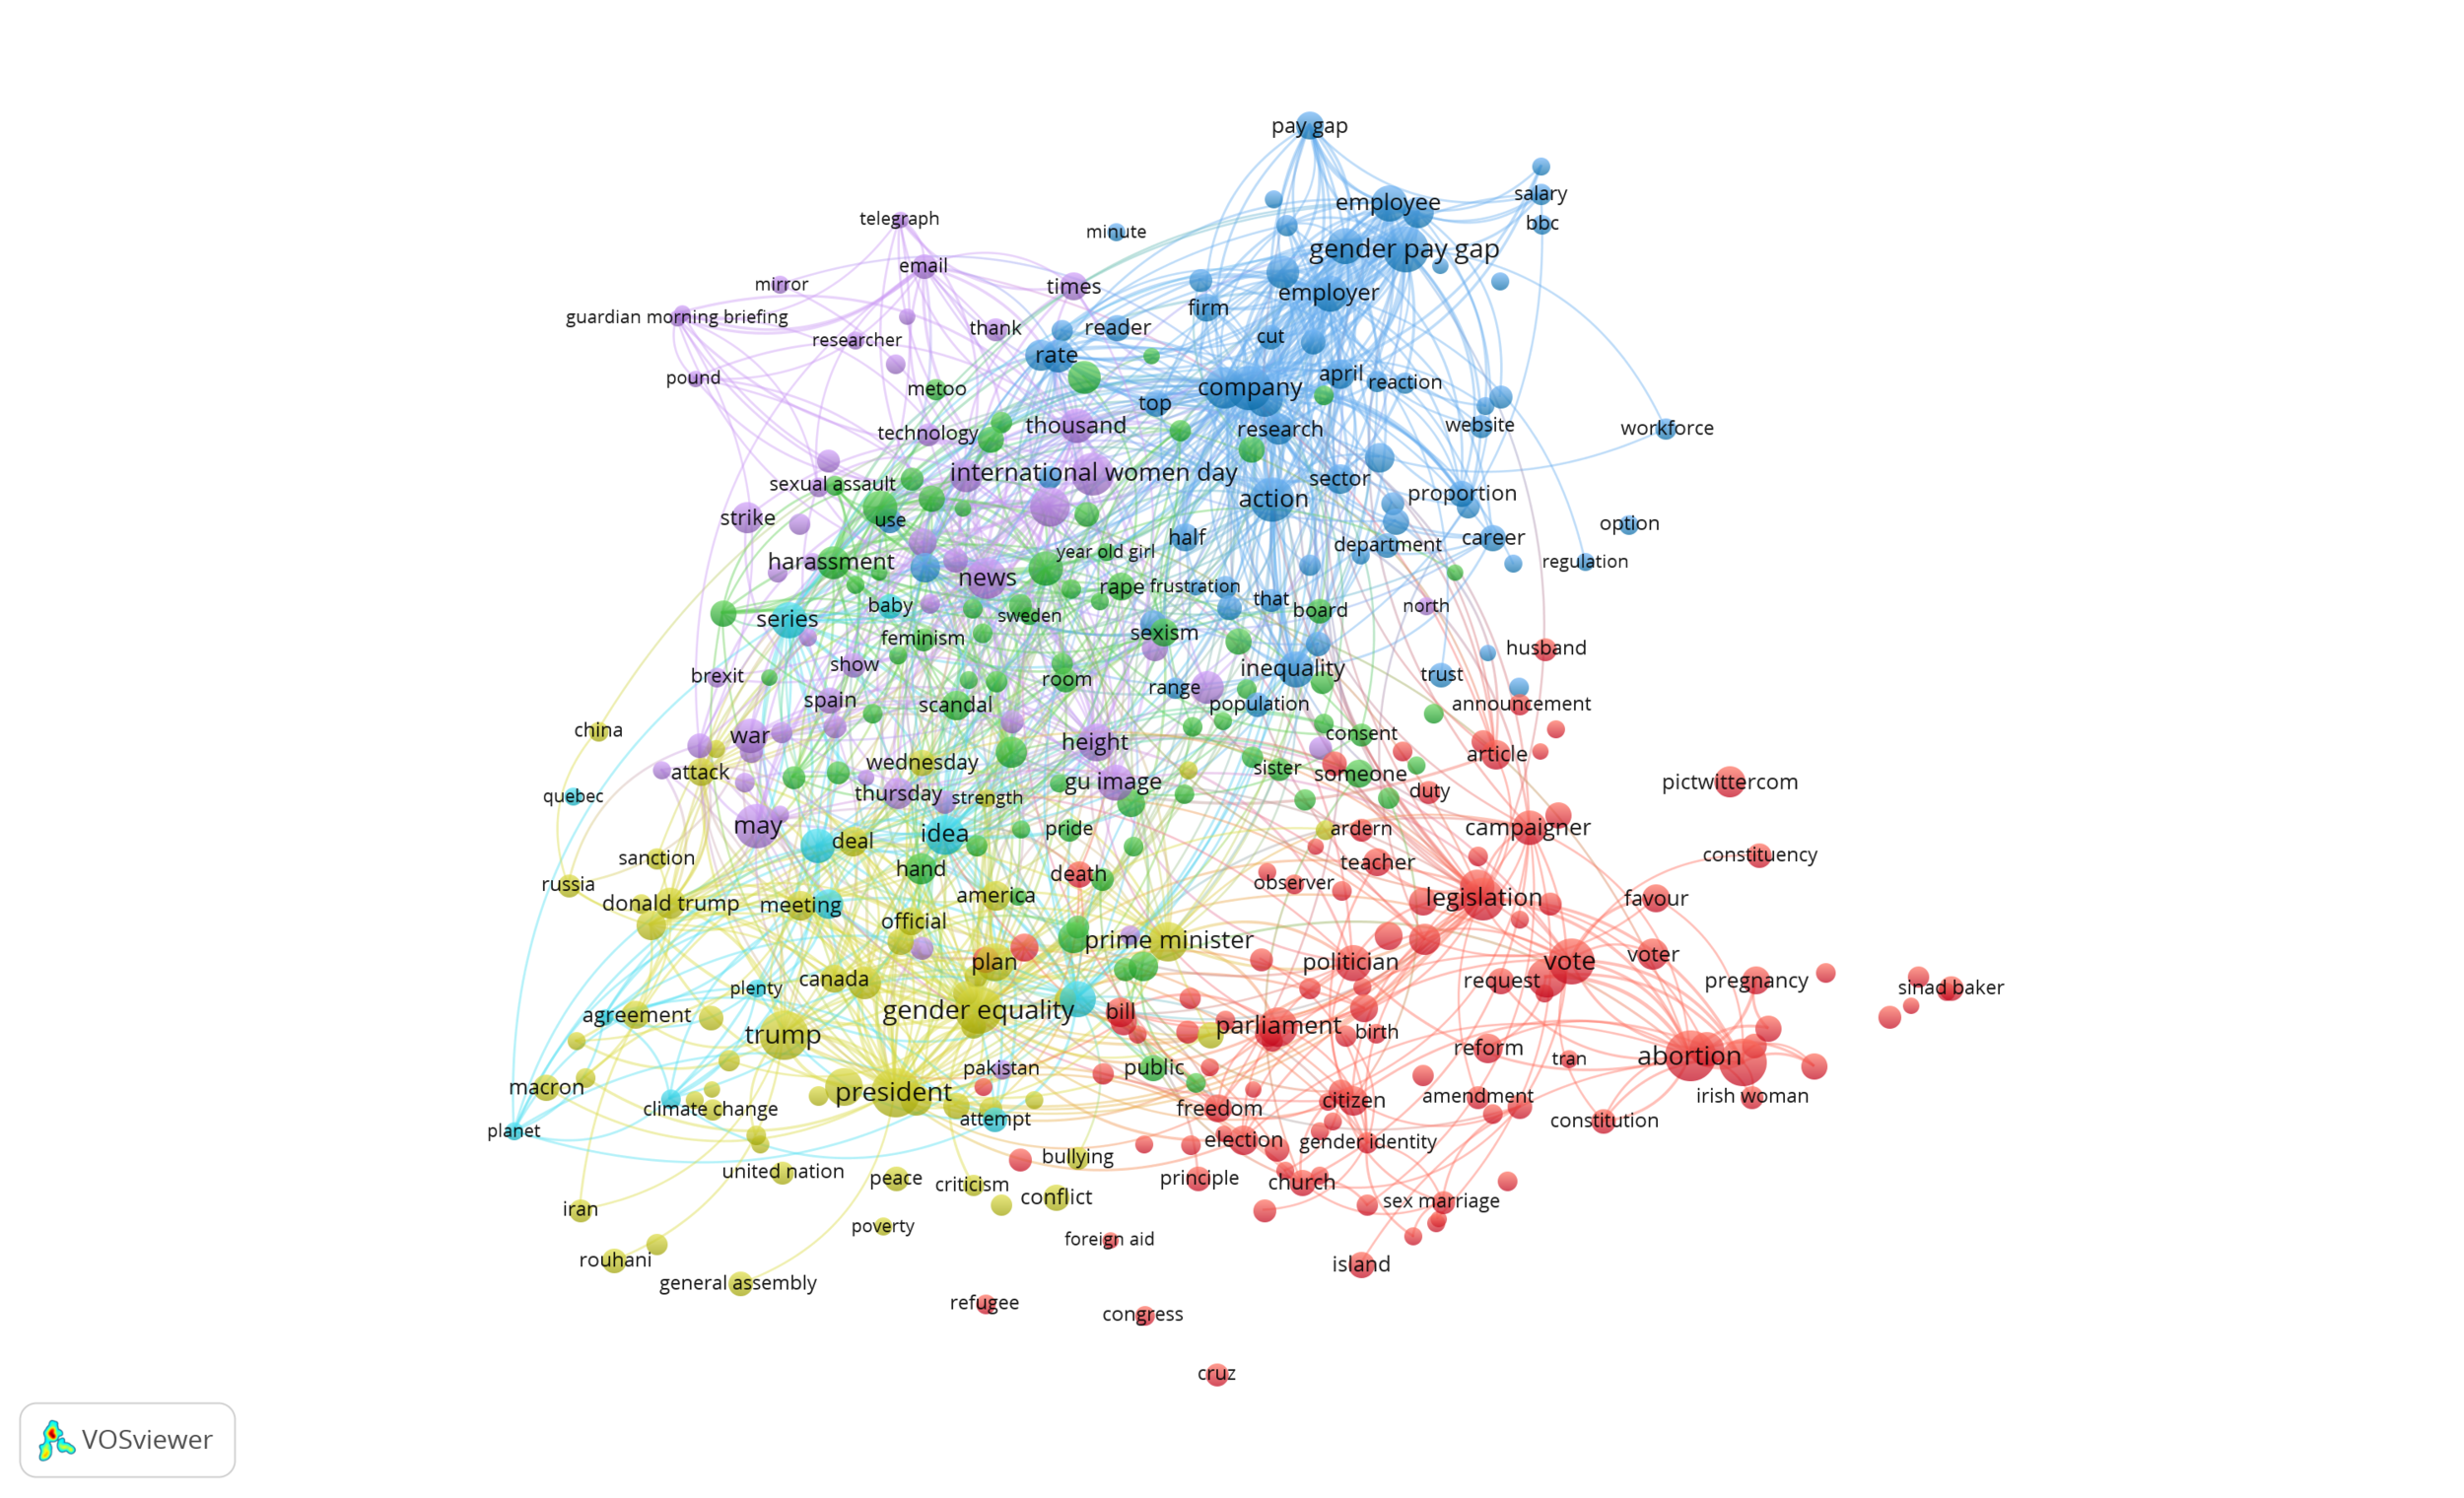
Map of co-occurrences based on terms in “articles since #MeToo”
Although terms can be assigned to clusters, it is (as already mentioned above) interesting to note the overlap between clusters. Terms that are characteristic for a cluster (e.g. “gender equality”) are related to other terms in other clusters.

Cluster overlap for the term “gender equality” (in “articles since #MeToo”)
Finally, we checked whether the main differences between both time periods we mapped with VOSviewer are also confirmed with a tidytext analysis of the frequency of words used in the two periods.

Words that are close to the red line in the above plots have similar frequencies in both sets of texts, for example “women”, “gender” and “equality” appear in both periods at the high frequency end. Words that are far from the line are words that are found more in one set of texts than another. For example, words like “immigrants”, “marches” and “protest” are found more frequenty in “articles before #MeToo”, while words like “employers”, “ireland” and “harassment” appear more frequently in “articles since #MeToo”. These findings are in line with the themes that appear in the VOSviewer maps.
CONCLUSION
We presented the text mining functionalities of VOSviewer by using an example of newspaper articles. The co-occurrence maps that are generated, visualize the relationships between frequently occurring terms in a set of documents.
* We used version 1.6.9 of VOSviewer (see www.vosviewer.com).
** The data can be dowloaded from my github.