Spatialpoints analysis and visualization of sub-Saharan African health facilities
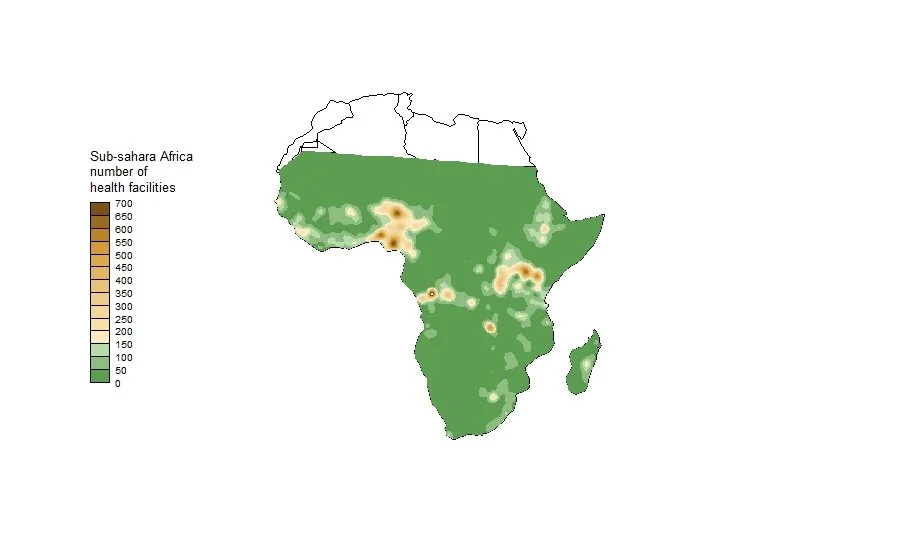
Using multiple geocoding methods, the World Health Organization’s Global Malaria Programme released a comprehensive spatial inventory of public health facilities in sub-Saharan Africa (1999)*.
We use this geocoded spatial database to visualize the distribution of health facilities with smoothed density maps. The accompanying document describes the workflow in R to produce various smoothed maps.
* https://data.humdata.org/dataset/health-facilities-in-sub-saharan-africa