Mapping scientific landscapes. Bibliometric analysis of COVID-19 research
Introduction
COVID-19 emerged as a severe contagious respiratory disease at the last days of 2019 and rapidly spread as a new pandemic around the world. The public health crisis mobilized the scientific community, especially in the life sciences. What is sometimes called a “covidisation” of academic research, resulted in an explosion of COVID-19 related publications in research journals.
In this post we apply bibliometric analysis as a set of quantitative methods to COVID-19 research. This includes the analysis of authorship patterns, the distribution of research across journals and countries, and the lexical analysis of the relationships between keywords in publications to provide a semantic map of COVID-19 research.
Bibliometric analysis
Bibliometric analysis is the use of quantitative methods to analyze and visualize the characteristics of published literature. It enables the exploration and analysis of large volumes of (unstructured) scientific data to uncover the intellectual structure and emerging trends of a research topic or field. In recent years, bibliometric analysis has gained popularity that can attributed to the availability of sciencific databases that ease the acquisition of large volumes of publications (e.g. Scopus, Wef of Science, Dimensions) and the accessibility of bibliometric software to gain insights from the analysis of bibliometric data (e.g. Gephi, R-package bibliometrix, VOSviewer).
The techniques for bibliometric analysis can be divided in two categories. In performance analysis, metrics are used to measure the productivity and the impact/influence of the different research constituants (authors, journals, institutions, countries) in a given field (e.g. number of publications, number of citations ). On the other hand, science mapping focuses on the relationships between the constituants. The visualization of collaborative networks through co-authorship and co-citation analysis and bibliographic coupling relevates the increased importance of collaborative research in science and its analysis on diverse levels (authors, institutions, countries). Another critical component of the mapping of scientific landscapes is co-word analysis. In contrast to other science mapping techniques that focus on the publications, in co-word analysis the emphasis is on the examination of the actual content of publications (the written content). Words that frequently appear together have a thematic relationship with each other. Co-word analysis identifies the main themes or topics covered in publications and is also helpful in identifying patterns and trends in the literature, making it an important method for knowledge discovery in databases.
Science mapping of COVID-19 research
In this post we focus on the different possibilities of science mapping the COVID-19 research field with VOSviewer (www.vosviewer.com). VOSviewer is a software tool to map the scientific landscape within a particular field. It enables to import and create datasets of publications and generates network visualizations of the relationships between the constituants of publications as well as the central topics that can be extracted from publications.
Before creating network visualizations in an interactive way with the graphical user interface of VOSviewer, it is necessary to provide bibliographic information. Different data sources can be used with VOSviewer. A first possibility is to use bibliographic database files that contain information about publications. VOSviewer also supports data from a reference manager application and the latest version of VOSviewer supports new data sources that can be queried interactively through APIs. We use a database file to illustrate how VOSviewer can be used for bibliometric analysis. These database files can be in various formats. VOSviewer supports exports from different sources (Scopus, Web of Science, Dimensions). As an example we use the Dimensions database which has a free web application to download bibliographic data (www.dimensions.ai). In order to obtain a high-level overview of research on “COVID-19”, we scanned the Dimensions database for English publications in the period 2020-2022 using the keywords “COVID-19”, “coronavirus” and “SARS-CoV-2”. The date of data retrieval was 25th july 2022. Bibliographic information of 2500 publications was gathered and the resulting CSV-file was imported in the VOSviewer-software (version 1.6.18). The data on which the following bibliometric analysis is based, can be downloaded from my Github.
The overall objective of the analysis is to present the knowledge structure of the COVID-19 research field. We consider bibliographic coupling, co-citation and co-author analysis to generate network visualizations that reveal the most prominent relationships between documents (publications), sources (journals) and countries. The text mining capabilities of VOSviewer and the network maps of co-occurring terms that are sourced from titles and abstracts of research articles, give an overview of research hotspots and identify future research directions.
1. Bibliographic coupling
The idea underlying bibliographic coupling is that publications that share common references are similar in their content and can be grouped (clustered) based on the citing publications. The connection between documents depends on the reference list they share. In this sense, bibliographic coupling helps determining the subject similarity of documents. Bibliographic coupling was performed using the full counting method and a threshold of minimum 10 citations was employed, resulting in 725 documents of the 2500 that meet the threshold ¹.
In fig.1 the relationship strenghts between documents is visualized. In VOSviewer, every possible combination of any two publications in the data set is analyzed. The higher the overlap in shared references between any two articles, the stronger the bibliographic coupling relationship or association strength. As a result, clusters of documents emerge that are based on their patterns of relatedness. The algorithm of VOSviewer maximizes the sum of the association strength of documents belonging to the same cluster while minimizing the size of the clusters to reflect an internally coherent set of studies on shared topics. Bibliographic coupling helps identifying research streams.

Fig. 1 : Bibliographic coupling of documents on COVID-19. First author and publication year are shown for each node (document). The size of each node represents the number of times a document has been cited. Each cluster was formed based on the link strengths (determined by the number of shared references) between the documents.
Bibliographic coupling reveals 13 distinct clusters of research focusing on COVID-19 (displayed by different colors). The clusters represent specific research areas related to COVID-19 research in the period 2020-2022. Documents classified in the clusters on the left hand of the visualization are mainly concerned with the description of epidemiological and clinical aspects of the coronavirus (e.g. COVID-19 and thrombotic disease, neurological complications of COVID-19) and disease management in clinical practice. Documents to the right hand of the visualization (darkblue cluster) are concerned with determinants of COVID-19 vaccine intension and vaccine acceptance and immunization practices for use with COVID-19 vaccines.
2. Co-citation analysis
Science mapping through co-citation analysis is based on the assumption that documents that are cited together frequently are similar thematically (co-citation occurs when the referring document refers two documents simultaneously in its reference list). In addition to finding the most influential publications, co-citation analysis also generates thematic clusters that reflect the intellectual structure of a research field from the perspective of the cited publications.

Fig. 2 : Co-citation network at the sources level.
To generate a co-citation network, the full counting method was used and a threshold of minimum 50 citations of a source (journal) was employed, resulting in a total of 277 cited journals that are grouped in 6 clusters ². The most cited documents are published in The New England Journal of Medicine, The Lancet and The Journal of The American Medical Association (JAMA).
3. Co-authorship analysis
To examine the intellectual collaboration among scholars, we performed a co-authorship analysis at the country level. Country co-authorship provides information aboutc collaborative relationships between authors in various countries. Using the full counting method and a minimum of 5 documents, the largest set of connected countries consists of 60 countries (of the 115) in 7 clusters ³. The size of each circle (node) in the co-authorship map indicates the number of documents produced by a country. The distance between any two nodes indicates the relatedness of their co-authorship link, and the thickness of the connecting line indicates the strength of the link. The larger the scale of cooperation is, the thicker the connecting line.

Fig. 3 : Co-authorship network between countries
The network of co-authorship shows that collaboration in COVID-19 research comes from a highly interconnected network with few isolated clusters. The United States has the highest degree of cooperation with other countries, with a total link strength of 410, followed by the United Kingdom (352). Research collaboration between countries is partly shaped by cultural differences.

In fig. 4 the collaborative links between the United States and other countries are mapped in detail. The US has the strongest links with China, the UK and Canada. There is also a considerable connection between countries from the European cluster (red) and the US.

Fig. 4 : Co-authorship relationships between the US and other countries
4. Co-occurrence analysis
Analysis of keywords can reveal the development trends and research differences in the field. Consequently, keywords co-occurrence analysis has become a common research method in bibliometric analysis. We used the text mining capabilities of VOSviewer to construct a network map of co-occurring keywords sourced from titles and abstracts of COVID-19 research documents. Based on a corpus of documents, co-word analysis provides a semantic map of the field of COVID-19 research.
To create a co-occurence term map we used the binary counting method and selected terms with a minimum occurrence of 20, which resulted in 573 that meet this threshold. Furthermore, the term map is based on the 60 % most relevant terms (344). These frequently co-occurring terms are clustered and these clusters can be interpreted as representing research areas present in the body of text documents on COVID-19 ⁴.
The conceptual idea behind keyword co-occurrence analysis is that when a set of words occur in different documents, the concepts behind these words are likely closely related. By extracting keywords from documents, we can establish how closely related these documents are.
In Fig. 5, each node represents a keyword, the size of the node indicates the number of occurrences of the keyword, and the links connecting nodes represent the relationships between keywords. The map generated by VOSviewer is a distance-based network where the space between the nodes represents the strength of the relation between knowledge domains. Different colors represent different groups of knowledge obtained through the clustering technique of VOSviewer. Terms in Fig. 5 are attributed to three distinct clusters.
Cluster 1 (red ; 143 terms) contains terms that refer to clinical epidemiology (patient, mortality, severe covid). The terms in cluster 2 (blue, 66 items) refer to disease management (treatment, management) and the terms in cluster 3 (green, 135 items) refer to vaccine research and vacine acceptance (vaccine, participant, attitude). Apparently, there seems to be an evolution from descriptive studies about the clinical features of COVID-19 and the treatment of the disease based on an understanding of its pathophysiology towards studies that focus on vaccin development and research about demographic and attitudinal factors that affect vaccine acceptance.
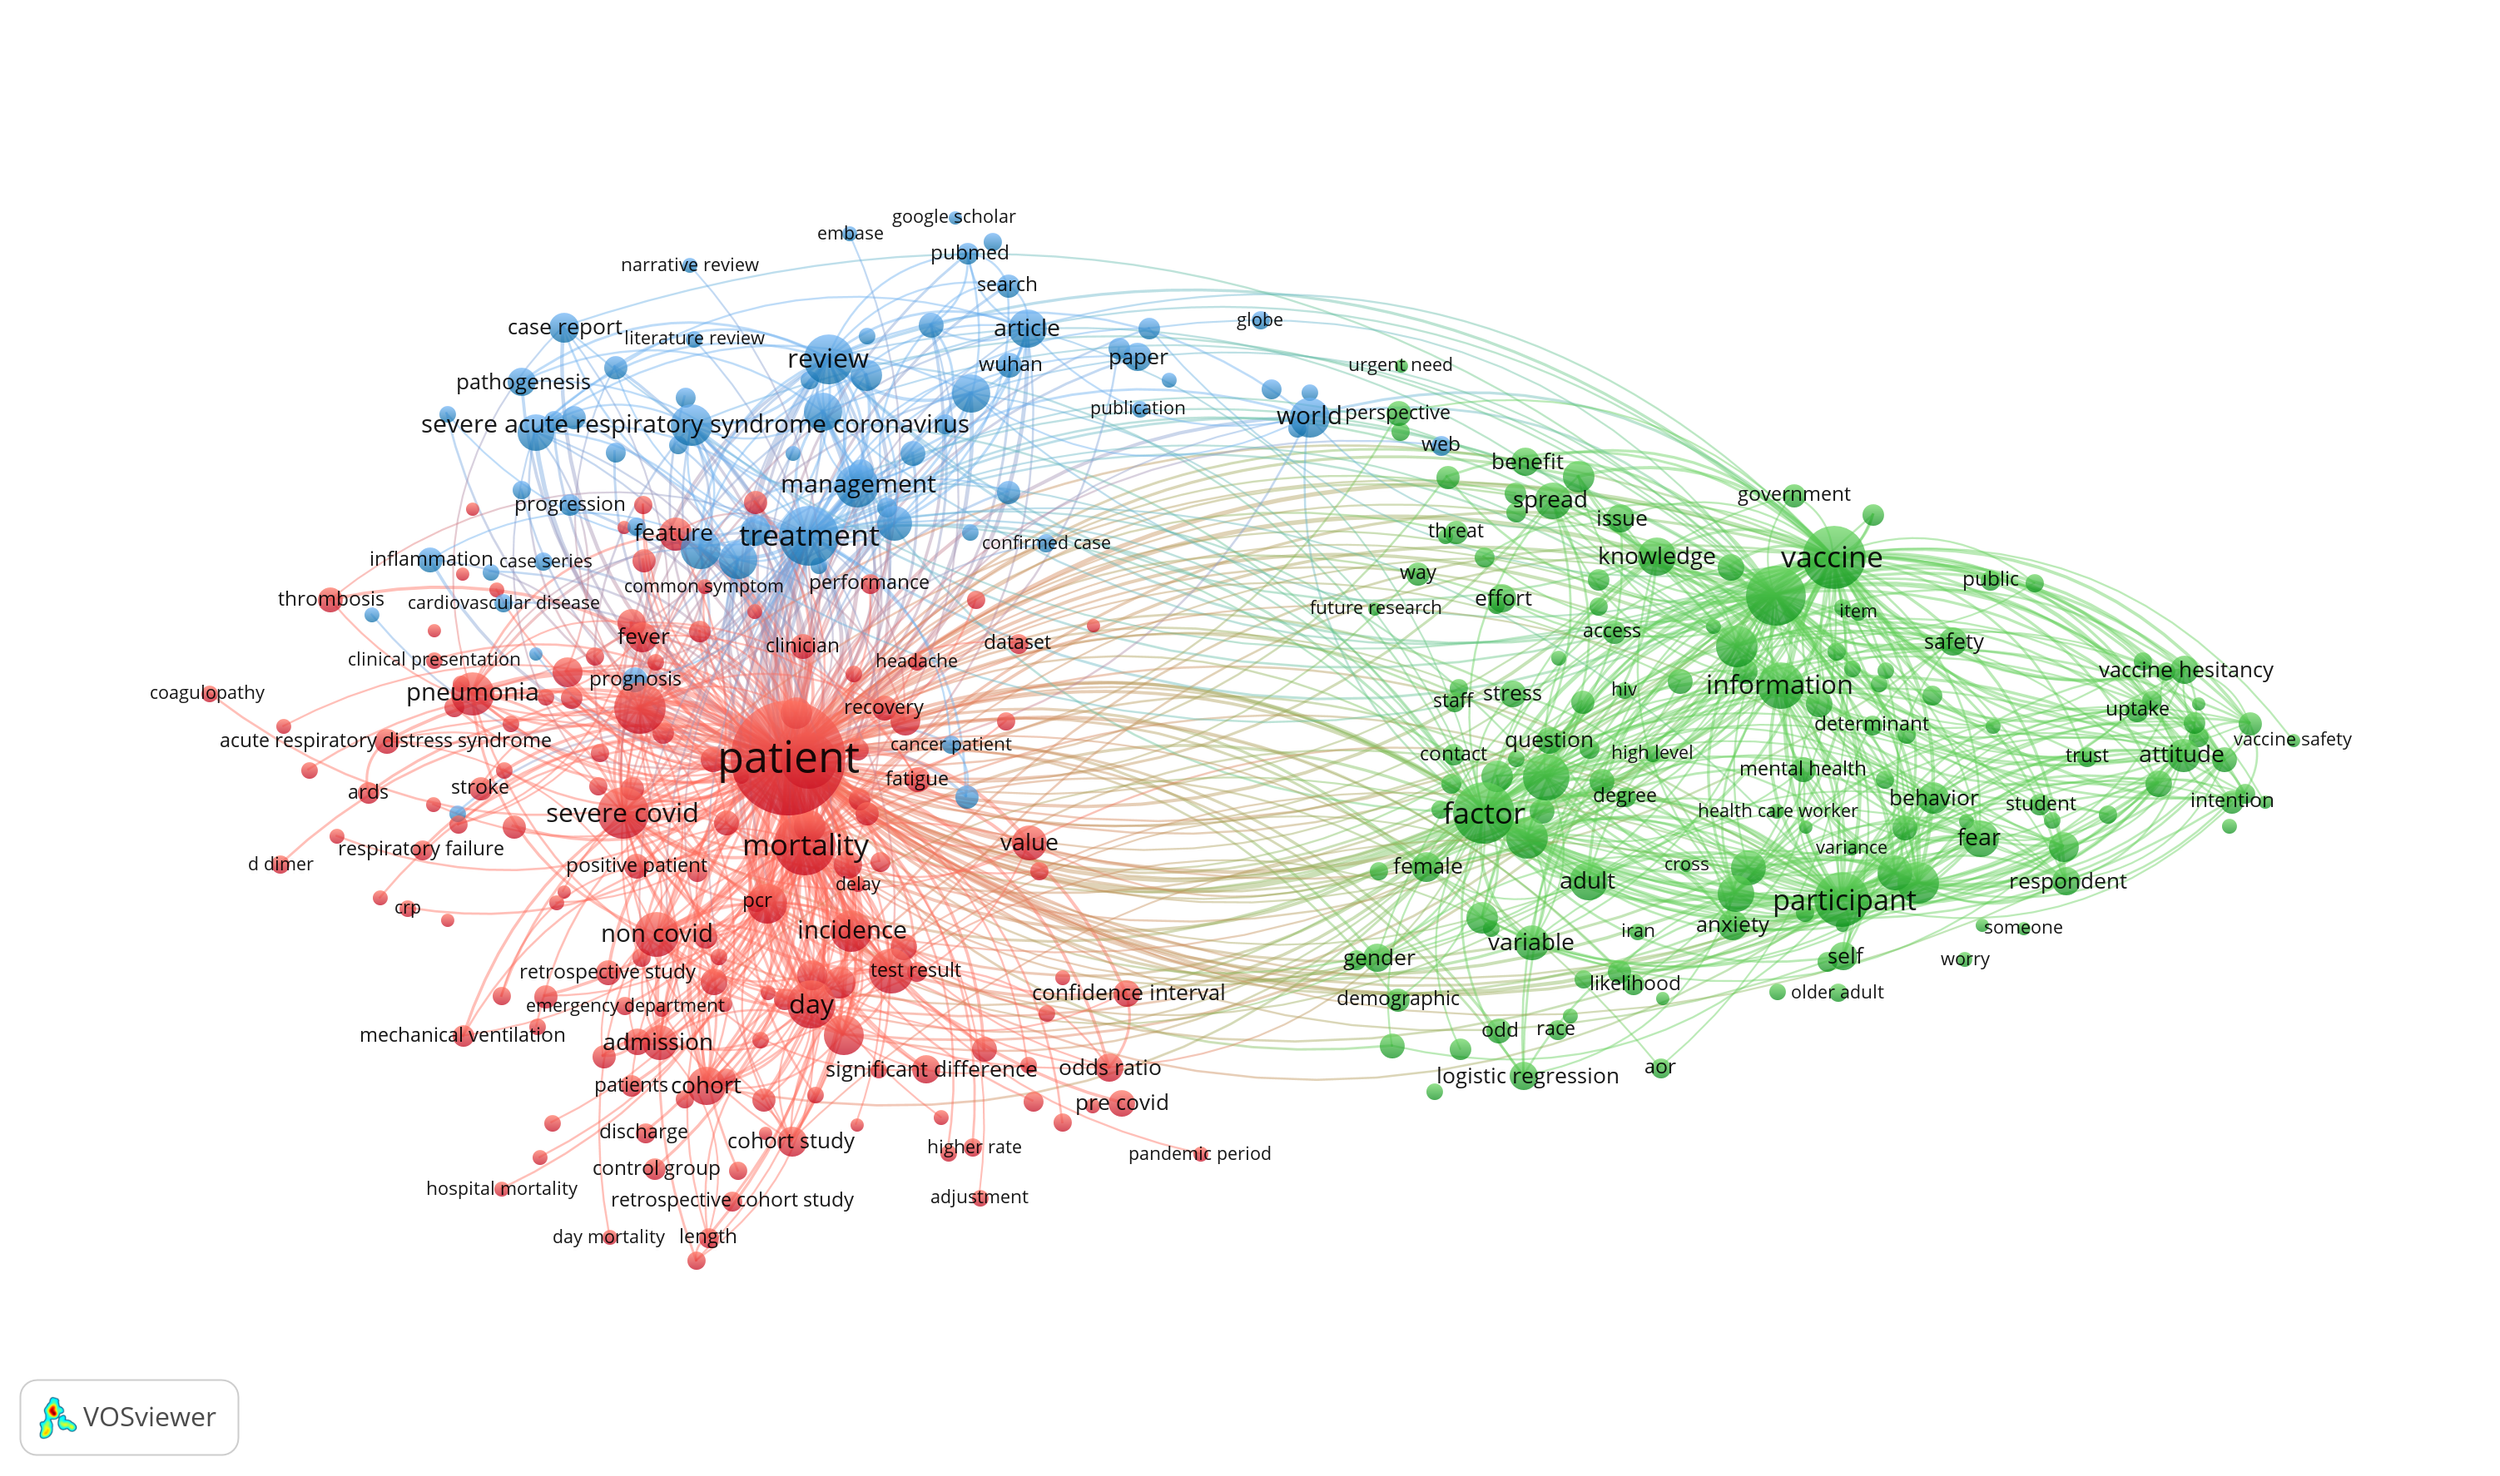
Fig. 5 : Research topics clustered by mapping term co-occurrences in titles/abstracts of COVID-19 related publications
The overlay visualization option in VOSviewer (Fig. 6) allows for a chronological view of publications. Studies from the beginning of the COVID pandemic are given purple color and recently published studies are given the yellow color. It is clear that the focus in recent research has shifted towards vaccination issues.

Fig. 6 : Overlay visualization of co-occurrence keywords network
Conclusion
The COVID-19 pandemic has led to unprecedented research activity. A bibliometric analysis was performed to assess the global state of COVID-19 research in the period 2020-2022. Visualization tools like VOSviewer enable researchers to analyze large datasets and to map the scientific landscape of COVID-19 research. Analysis of co-citation relationships shows that the most cited studies are published in top-rated journals. Network analysis of co-authorship reveals that the COVID-19 flow of scientific information comes from a highly interconnected network of international collaboration. Finally, keyword co-occurrence networks reveal the knowledge map of the development of COVID-19 research.
NOTES
¹ We used the association strength method for normalization of the strength of the relationship between documents. Weights are based on the citations attribute which indicates the number of citations received by a document.
² LinLog modularity was chosen as normalization method and weights are based on the citations attribute which indicates the total number of citations received by all publications published by a source.
³ Association strength was chosen as measure for normalization and weights are based on documents (the number of documents published by a country).
⁴ For normalizing the strength of the links between items, we used the association strength method. Weights are based on the number of occurrences. In the case of binary counting the occurence attribute indicates the number of documents in which a term occurs at least once.
REFERENCES
Donthu, N., Kumar, S., Mukherjee, D., Panday, N. & Lim, W.M. (2021). How to conduct a bibliometric analysis : An overview and guidelines, Journal of Business Research, 133, pp. 285-296.
Van Eck, N.J., & Waltman, L. (2010). Software survey: VOSviewer, a computer program for bibliometric mapping. Scientometrics, 84(2), 523–538.
Van Eck, N.J., & Waltman, L. (2011). Text mining and visualization using VOSviewer. ISSI Newsletter, 7(3), 50–54.
Van Eck, N, J., & Waltman, L. (2014). Visualizing Bibliometric Networks. In Y. Ding, R. Rousseau, & D. Wolfram (Eds.), Measuring scholarly impact: Methods (pp. 285-320). Springer.